The Most Dangerous Roads in Phoenix, Arizona — 2025 Data Analysis
Which roads in Phoenix are the most dangerous? We didn’t guess — we analyzed the data. Using the NHTSA Fatality Analysis Reporting System (FARS) covering 2015–2022 and Phoenix Police Department calls-for-service data from 2018–2025, we identified the roads where people are most likely to be killed or seriously injured.
Arizona’s Deadliest Highways
| Highway | Fatal Crashes (2015–2022) |
|---|---|
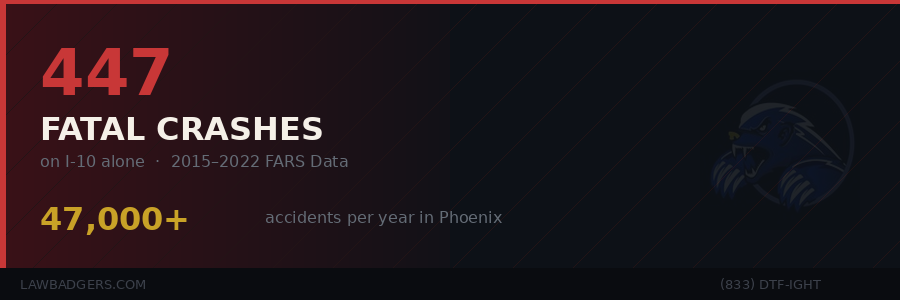
| I-10 | 447 |
| US-60 | 253 |
| I-17 | 209 |
| I-40 | 204 |
| SR-89 | 89 |
| I-19 | 72 |
| SR-87 | 68 |
| SR-95 | 63 |
| US-93 | 58 |
| SR-347 | 47 |
[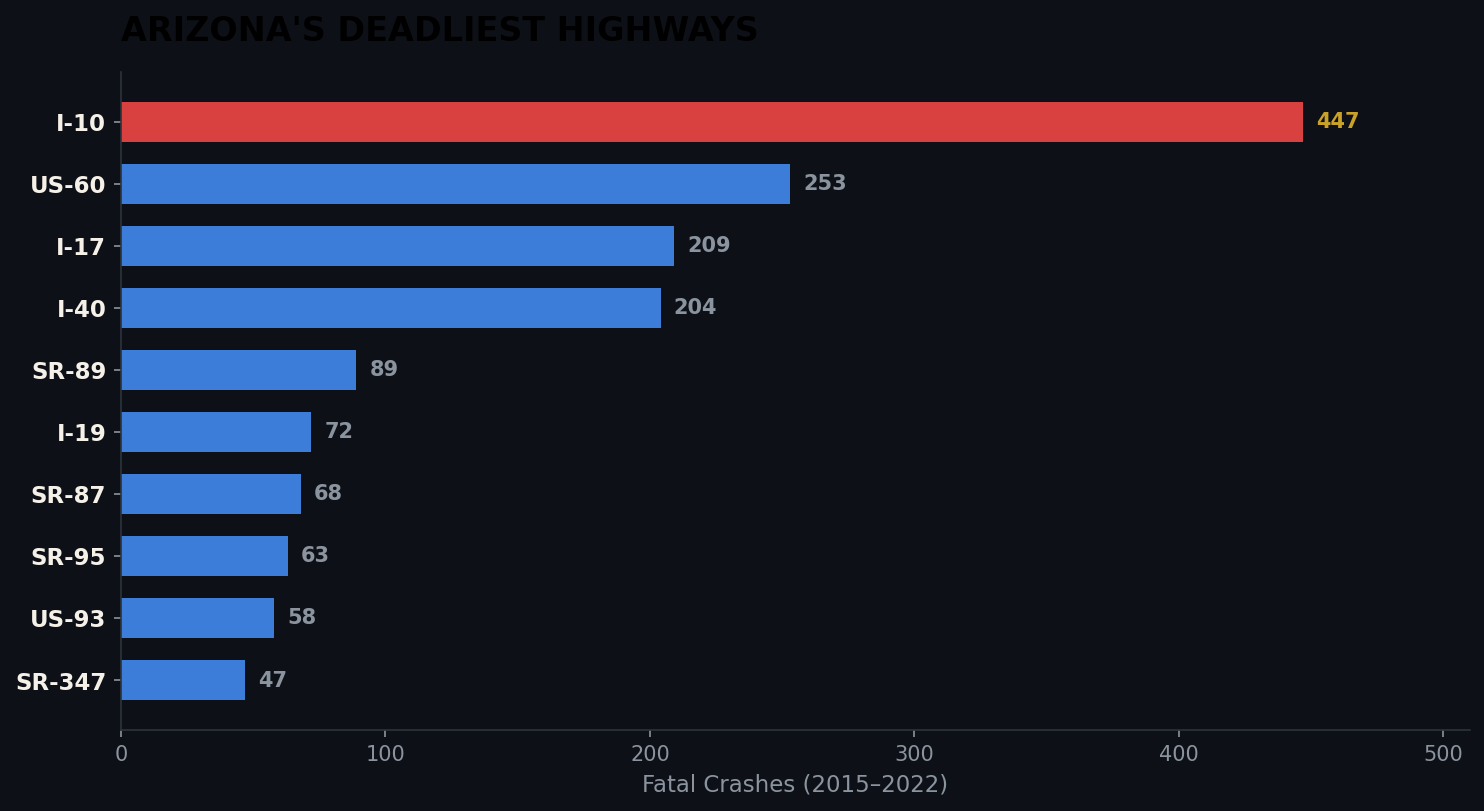
I-10 dominates — nearly double the next most dangerous highway. The Phoenix-to-Tucson corridor is especially deadly, combining high speeds, heavy truck traffic, extreme heat, and long monotonous stretches that breed drowsy driving.
I-17 between Phoenix and Flagstaff is the third deadliest, with fatalities concentrated on the winding grades near Black Canyon City and Sunset Point.
Phoenix’s Deadliest Surface Streets
| Street | Fatal Crashes (2015–2022) |
|---|---|
| Indian School Rd | 84 |
| McDowell Rd | 63 |
| 19th Ave | 56 |
| 43rd Ave | 55 |
| Broadway Rd | 53 |
| 35th Ave | 49 |
| Van Buren St | 47 |
| Thomas Rd | 45 |
| Camelback Rd | 42 |
| 51st Ave | 38 |
Indian School Road is the deadliest surface street in Arizona — averaging more than 10 fatalities per year. The West Phoenix corridor where many of these streets converge is the most dangerous grid in the state.
Phoenix Accident Volume — The Bigger Picture
Fatal crashes are the tip of the iceberg. Phoenix Police data reveals the full scale:
- 379,090 total traffic accidents (2018–2025)
- ~47,000 accidents per year
- 79,651 injury accidents — 21% of all crashes
- ~20,000 hit-and-runs per year — nearly half of all incidents
- 1,155 fatal accidents in the police dataset
- 474 flagged DUI-related crashes
The deadliest time is Friday between 3–6 PM. The deadliest season is summer — combining heat, monsoon storms, and vacation traffic.
What Makes Phoenix Roads So Dangerous?
The grid design. Phoenix’s road system was built for speed and throughput. Major arterials are wide, straight, and spaced exactly one mile apart. This encourages high speeds but creates deadly intersections every mile where high-speed traffic crosses.
Pedestrian hostility. Many Phoenix arterials have no sidewalks, inadequate crosswalks, and crossing distances of 100+ feet. Pedestrians are forced to interact with high-speed traffic in ways that are inherently dangerous.
Heat. Extreme temperatures cause tire failures, overheating vehicles, and impaired driver judgment. Road surface temperatures exceeding 150°F accelerate tire degradation.
Growth. Maricopa County’s population has grown 12% since 2015, but fatal crashes have grown 50%. Infrastructure hasn’t kept pace with the number of vehicles on the road.
How We Use This Data
The Law Badgers are the only personal injury firm in Phoenix that has built this crash data analysis from the ground up. We use it to establish the foreseeability of accidents at specific locations — a critical element in negligence cases. We use it to counter insurance company arguments that a crash was “unforeseeable.” And we use it to contextualize the severity of specific corridors when presenting cases to juries.
This isn’t marketing — it’s litigation preparation. And it’s the kind of work that separates the Law Badgers from every other firm in Phoenix.
Your Legal Rights
If you’ve been injured on any of these roads, the statute of limitations gives you two years to file. But evidence disappears much faster — what to do immediately after an accident. Call the Law Badgers at (833) DTF-IGHT for a free consultation.
INJURED? GET A FREE CONSULTATION.
The Law Badgers fight for maximum compensation. No fee unless we win.
Call (833) DTF-IGHT